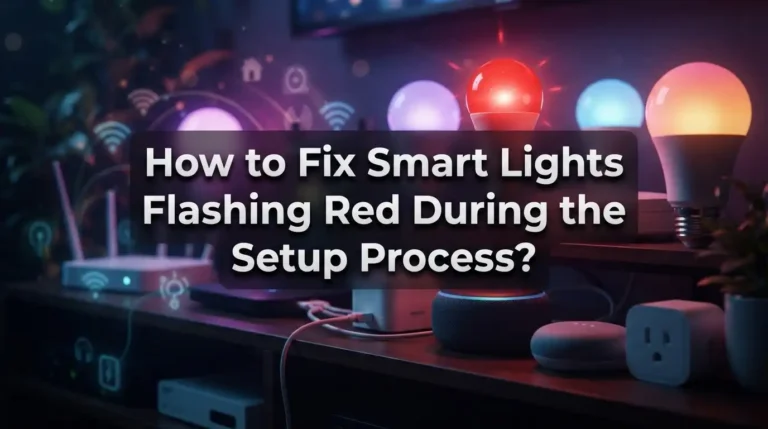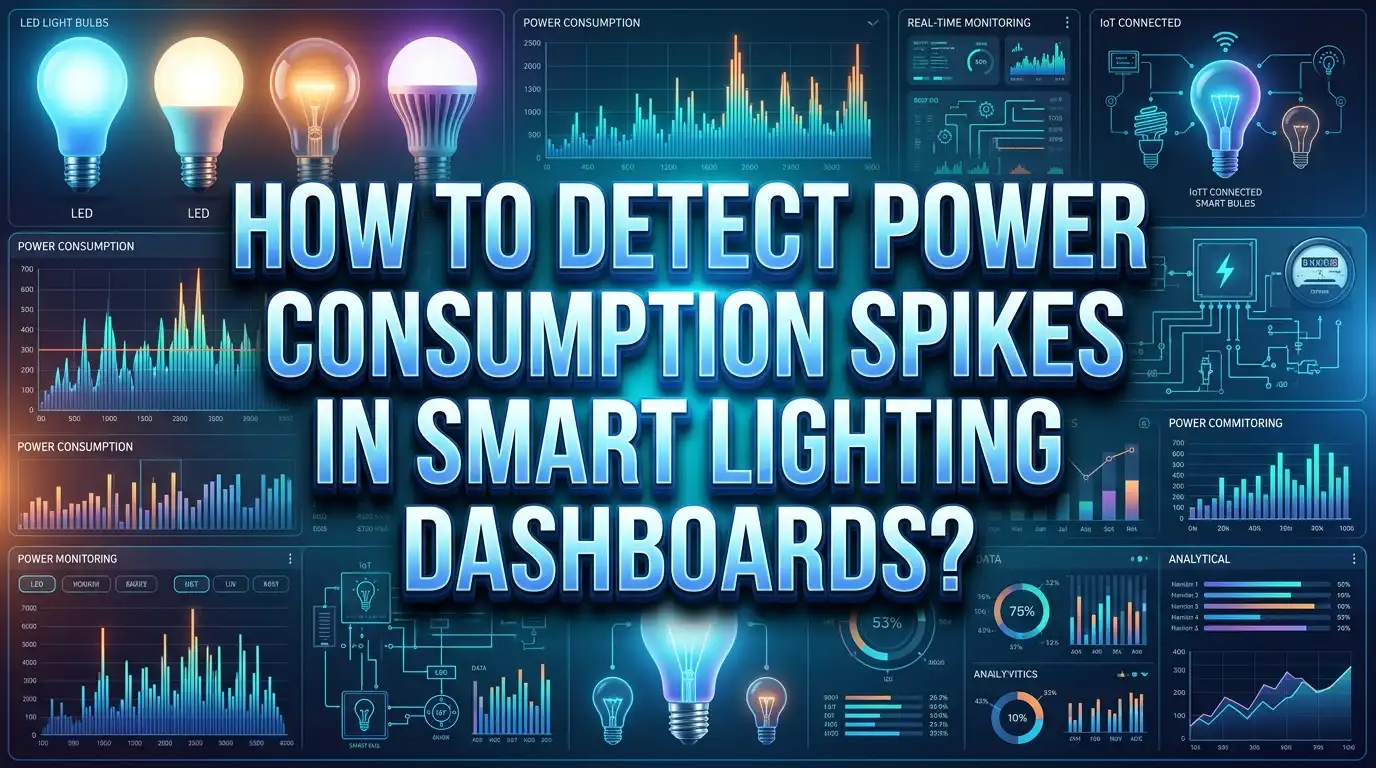
How to Detect Power Consumption Spikes in Smart Lighting Dashboards?
Have you ever looked at your smart lighting dashboard and noticed a sudden, unexplained jump in power usage? You are not alone. Power consumption spikes in smart lighting systems are one of the most common issues faced by homeowners and facility managers alike.
Smart lighting dashboards give you real time visibility into how much energy your lights consume. But raw data alone does not solve the problem. You need to know what causes these spikes, how to spot them quickly, and what actions to take once you find them.
The good news is that detecting and fixing power consumption spikes is a straightforward process once you understand the right tools and methods.
This guide walks you through everything from reading your dashboard data to setting up automated alerts. Whether you manage a commercial building or a smart home, you will find practical solutions you can apply today. Let’s get started.
In a Nutshell
- 1. Understand your baseline first. You cannot detect a spike unless you know what normal power consumption looks like for your lighting system. Record at least two to four weeks of data before drawing conclusions.
- 2. Use real time monitoring features in your dashboard. Most smart lighting platforms offer live wattage readings. Watch for sudden jumps that exceed your average consumption by 20% or more, as these often indicate a problem.
- 3. Set up automated threshold alerts. Configure your dashboard to send notifications when power draw crosses a specific wattage limit. This removes the need to check the dashboard manually every hour.
- 4. Check hardware before blaming software. Faulty LED drivers, aging fixtures, and loose wiring cause most power spikes. A quick physical inspection can save you hours of troubleshooting.
- 5. Leverage historical data analysis. Compare current usage patterns with past weeks or months. Seasonal changes, occupancy shifts, and daylight hours all affect consumption and can explain some spikes.
- 6. Consider AI and machine learning tools. Advanced systems can learn your usage patterns and automatically flag unusual activity. These tools reduce false alarms and improve detection accuracy over time.
What Are Power Consumption Spikes in Smart Lighting
A power consumption spike is a sudden and temporary increase in the electrical energy used by your lighting system. These spikes appear as sharp peaks on your dashboard graphs. They last anywhere from a few seconds to several minutes.
Normal lighting power consumption follows a predictable pattern. Lights turn on, draw a steady wattage, and turn off. A spike breaks this pattern. For example, a group of LED panels rated at 40 watts each might suddenly draw 70 watts for no apparent reason. This excess draw shows up as a peak on your energy graph.
Spikes differ from gradual increases in consumption. A gradual rise might happen because you added new fixtures or extended operating hours. A spike is abrupt and often returns to normal levels quickly. Think of it as the difference between slowly turning up the volume and someone suddenly shouting.
Smart lighting dashboards track these events using data from smart meters, sensors, and connected controllers. The dashboard collects wattage readings at regular intervals, often every 15 seconds to 15 minutes. When a reading jumps far above the average, the system records it as an anomaly.
Understanding what a spike looks like on your specific dashboard is the first step. Some dashboards use color coding, where red zones indicate abnormal readings. Others use line graphs where spikes appear as tall, narrow peaks. Get familiar with your dashboard’s visual format so you can spot issues at a glance.
Common Causes of Power Spikes in Smart Lighting Systems
Knowing why spikes happen makes detection much easier. Several factors contribute to unexpected power draws in smart lighting setups.
Faulty LED drivers are one of the most frequent causes. LED drivers regulate the current flowing to your bulbs. When a driver starts to fail, it can send irregular bursts of power to the fixture. This creates a spike on your dashboard. A single malfunctioning driver can affect an entire circuit of connected lights.
Inrush current is another common culprit. When LED lights first turn on, they briefly draw more power than their rated wattage. This startup surge is normal in small amounts. But if many fixtures turn on at the same time, the combined inrush current creates a noticeable spike.
Loose or corroded wiring can cause intermittent contact issues. When a connection is loose, electricity arcs across the gap. This arcing draws extra power and shows up as an irregular spike pattern on your dashboard. It also poses a fire hazard.
Incompatible dimmer switches create spikes as well. Older dimmers designed for incandescent bulbs do not work well with LED fixtures. They cause flickering and irregular power draws that appear as repeated small spikes on your consumption graph.
Power grid fluctuations from your utility company can also cause spikes. Voltage surges from the grid travel through your electrical system and affect every connected device, including your smart lights. Surge protectors can help buffer these external events.
Finally, software glitches in your smart lighting controller or hub can trigger all fixtures in a zone to activate simultaneously. This creates a large spike that has nothing to do with hardware failure.
How to Establish a Power Consumption Baseline
You cannot detect a spike without knowing what normal looks like. A baseline is your reference point for expected power consumption under standard conditions.
Start by recording data for at least two to four weeks. This time frame captures daily patterns, weekday versus weekend differences, and short term weather effects. Most smart lighting dashboards store historical data automatically, so you may already have this information available.
During the baseline period, note the operating hours of each lighting zone. Record the total wattage of fixtures in each zone. Multiply the number of fixtures by their rated wattage to calculate the expected draw. For example, 10 LED panels rated at 30 watts each should draw approximately 300 watts when all are on at full brightness.
Compare your calculated expected draw with the actual readings on your dashboard. Small differences of 5% to 10% are normal due to driver efficiency and environmental factors. Differences above 15% warrant investigation.
Create a simple spreadsheet or use your dashboard’s built in reporting tool to log average consumption by hour. You will likely notice patterns. Lights draw more during early morning and evening hours in office settings. Residential systems peak during evening hours. Understanding these patterns lets you distinguish between a normal peak and a true spike.
Document any events that affect consumption during the baseline period. A company event, a maintenance day, or a seasonal time change can all shift the pattern. Exclude these outlier days from your baseline calculation to keep it accurate.
Reading Your Smart Lighting Dashboard Correctly
Your dashboard is your primary tool for spike detection. But many users overlook key features that make detection faster and more accurate.
Most dashboards display power consumption as a line graph or bar chart over time. The X axis shows time intervals, and the Y axis shows wattage or kilowatt hours. A spike appears as a sharp vertical jump in the line or a tall bar that stands out from the surrounding data points.
Look for the zoom feature on your dashboard. Zooming into a specific time window lets you see the exact moment a spike occurred. This helps you correlate the spike with a specific event, such as a lighting schedule change or a sensor trigger.
Use the zone or circuit filter to isolate specific areas. If your dashboard monitors the entire building, a building wide view might mask small spikes in individual zones. Filter down to a single floor, room, or circuit to see detailed consumption data for that area.
Many platforms offer a comparison view that overlays today’s data on top of yesterday’s or last week’s data. This side by side view makes spikes immediately obvious. If today’s line jumps 30% above the same time last week, you have a clear indicator.
Check for built in anomaly markers. Platforms like Home Assistant and commercial building management systems often flag unusual readings automatically. These markers appear as dots, icons, or color changes on your graph. Enable this feature if it is not already active.
Do not ignore the numbers panel. While graphs are great for spotting trends visually, the raw numbers tell you the exact wattage at any given moment. A reading of 450 watts in a zone rated for 300 watts is a clear spike, even if the graph does not look dramatic at a wide zoom level.
Setting Up Automated Threshold Alerts
Manual monitoring is time consuming and unreliable. Automated alerts do the watching for you and notify you instantly when something goes wrong.
A threshold alert triggers when power consumption exceeds a value you set. For example, if your lighting zone normally draws 200 watts, you can set an alert at 260 watts, which represents a 30% increase above normal. Any reading above this value sends a notification to your phone or email.
Start by calculating your threshold value. Take your baseline average and add a buffer. A 20% to 30% buffer works well for most systems. Setting the threshold too low causes false alarms from normal fluctuations. Setting it too high means you miss real spikes.
Configure alerts in your dashboard’s settings panel. Most platforms, including Home Assistant, Schneider Electric, and Emporia Vue, have built in alert systems. Navigate to the alerts or notifications section. Select the zone or device you want to monitor. Enter your threshold wattage value.
Choose your notification method. Email alerts work for non urgent issues. SMS or push notifications are better for critical spikes that need immediate attention. Some systems also support webhook integrations that can trigger automated responses, such as dimming lights or shutting off a zone.
Set time based conditions for smarter alerts. A spike at 3 AM when no one is in the building is more concerning than a spike at 9 AM when everyone arrives. Configure your alerts to apply different thresholds for different times of day. This reduces noise and focuses your attention on truly unusual events.
Review and adjust your thresholds every month. As seasons change and occupancy patterns shift, your baseline will move. Update your alert values to match the new normal.
Using Historical Data to Identify Spike Patterns
Historical data reveals patterns that real time monitoring alone cannot show. Looking back over weeks or months helps you understand whether a spike is a one time event or a recurring problem.
Pull up your dashboard’s historical reports and look at weekly and monthly trends. Recurring spikes at the same time each day often point to scheduled events. For example, a daily spike at 8:00 AM in a commercial building might be caused by all lights activating simultaneously when the building management system triggers the morning schedule.
Compare energy consumption across similar days. Monday through Friday should look similar in an office environment. If Wednesday consistently shows a spike that other days do not, investigate what is different about that day. Perhaps a conference room uses extra lighting for a recurring meeting.
Seasonal patterns matter too. Shorter daylight hours in winter cause lighting systems to run longer and harder. Daylight harvesting sensors may increase fixture output to compensate for reduced natural light. This gradual increase is normal, but it can amplify the appearance of spikes on your graph.
Use your dashboard’s export feature to download data into a spreadsheet. Apply simple formulas to calculate daily averages, peak values, and standard deviations. Any reading that falls more than two standard deviations above the mean is statistically unusual and worth investigating.
Overlay utility bill data with your dashboard readings. If your utility company provides interval data, compare it with your dashboard logs. Discrepancies between the two data sources may indicate metering errors, unmonitored circuits, or dashboard calibration issues that are distorting your spike readings.
Leveraging AI and Machine Learning for Spike Detection
Manual threshold alerts work well for simple setups. But AI and machine learning tools take detection to the next level by learning your system’s behavior over time.
AI algorithms analyze thousands of data points to build a model of your normal energy pattern. Once the model is trained, it can detect anomalies that fall outside the expected range. Unlike static thresholds, AI adjusts its expectations based on time of day, day of week, season, and occupancy.
Research shows that algorithms like LightGBM and autoencoders perform well for energy anomaly detection in buildings. LightGBM offers accuracy and speed for real time detection. Autoencoders learn patterns by compressing and reconstructing data, then flag readings that do not match the expected reconstruction.
You do not need to build these models from scratch. Platforms like Home Assistant support community built integrations that include anomaly detection. Commercial energy management systems from providers like Schneider Electric and Spacewell Energy include built in AI features that monitor consumption across multiple zones.
To get started, feed your system at least six months of historical data. This gives the AI model enough information to understand seasonal and operational variations. The more data you provide, the more accurate the model becomes.
AI also reduces false positives. A static threshold might flag a spike caused by a cloudy day triggering daylight sensors. An AI model recognizes this as a normal response to environmental conditions and ignores it. This saves you from chasing problems that do not exist.
Over time, the AI model improves through feedback. When you mark an alert as a true positive or false alarm, the system adjusts its sensitivity. This feedback loop makes detection more precise with each passing month.
Inspecting Hardware When Spikes Are Detected
Software tools identify the spike. But fixing the problem often requires a physical inspection of your lighting hardware.
Start with the fixtures in the zone that reported the spike. Check for visible signs of damage, such as discoloration, burned marks, or flickering. LED fixtures that flicker often have a failing driver or a loose connection at the terminal block.
Test each fixture individually if possible. Turn off all lights in the zone, then turn them on one at a time while watching your dashboard. The fixture that causes the wattage to jump beyond its rated value is your problem source.
Inspect all wiring connections in the zone. Loose wire nuts, corroded terminals, and damaged insulation can all cause intermittent power draws. Tighten all connections and replace any wire nuts that show signs of heat damage. If you are not comfortable working with electrical wiring, hire a licensed electrician.
Check your dimmer switches and control modules. Older dimmers that are not rated for LED loads cause power irregularities. Replace them with LED compatible dimmers. Verify that your control modules, such as Zigbee or Z Wave controllers, are running the latest firmware. Outdated firmware can cause unexpected commands that turn fixtures on at full power.
Examine your surge protection. If you do not have surge protectors on your lighting circuits, external voltage spikes from the grid pass directly to your fixtures. Install surge protection devices at your electrical panel to buffer these events. This protects both your hardware and your dashboard data accuracy.
Optimizing Lighting Schedules to Prevent Spikes
Many power spikes are caused by poor scheduling rather than hardware failure. Adjusting your lighting schedules can eliminate a large percentage of spike events.
The most common scheduling problem is simultaneous activation. When all lights in a building turn on at the same moment, the combined inrush current creates a massive spike. This is especially noticeable in commercial buildings with hundreds of fixtures on a single schedule.
Stagger your activation times across zones. Instead of turning on every light at 7:00 AM, activate Zone 1 at 6:55, Zone 2 at 7:00, and Zone 3 at 7:05. This spreads the inrush current over a longer period and flattens the spike on your dashboard.
Review your occupancy sensor timeout settings. If sensors are set to turn lights off after just 30 seconds of inactivity, they may cycle lights on and off frequently. Each cycle creates a small inrush spike. Extending the timeout to 5 or 10 minutes reduces cycling and smooths out consumption.
Adjust dimming levels for different times of day. Running lights at 100% brightness all day is wasteful and contributes to higher peak consumption. Set dimming schedules that reduce output during off peak hours or when natural daylight supplements the interior lighting.
Use daylight harvesting sensors effectively. These sensors adjust artificial light output based on available natural light. When properly calibrated, they reduce overall consumption and prevent unnecessary spikes caused by fixtures running at full power when sunlight is already filling the space.
Review your holiday and weekend schedules separately. Buildings that run weekday schedules on weekends waste energy and create spikes in empty spaces. Create dedicated profiles for weekends, holidays, and after hours that keep only essential lighting active.
Monitoring Multiple Zones for Cross System Spikes
In larger installations, spikes in one zone can affect other zones on the same circuit. Cross system monitoring helps you identify these hidden connections.
Your smart lighting dashboard should display each zone as a separate data stream. Look at all zones simultaneously on a multi panel view. If two or more zones spike at the exact same time, they may share a common cause. This could be a shared circuit breaker, a central controller, or a building wide voltage surge.
Use correlation analysis to find relationships between zones. If Zone A always spikes two minutes before Zone B, there may be a cascading trigger in your automation rules. One zone’s activation might overload a shared transformer, which then causes a brief surge in an adjacent zone.
Check your electrical panel layout. Zones that share a breaker or a neutral wire can influence each other’s readings. A high draw in one zone drops the voltage available to another, causing the second zone to compensate by drawing more current. Your dashboard shows this as a spike in the second zone even though the root cause is in the first.
Implement submetering for critical zones. While whole building monitoring gives you the big picture, submeters on individual circuits provide the detail needed to isolate cross system issues. Many smart energy monitors support submetering through current transformer clamps installed at the electrical panel.
Create a zone map that documents which circuits serve which areas. This reference document helps you trace spikes back to their physical source without having to open the panel every time. Keep it updated as you add or reconfigure zones.
Using Data Export and External Tools for Deeper Analysis
Your dashboard’s built in tools handle most detection tasks. But exporting data to external tools gives you more analytical power.
Export your data in CSV format from your dashboard. Most platforms support this feature in their reporting section. Open the CSV file in a spreadsheet application. Use conditional formatting to highlight any reading that exceeds your threshold. This gives you an instant visual overview of every spike in the data set.
Calculate moving averages to smooth out normal fluctuations. A 15 minute or 1 hour moving average filters out noise and makes true spikes stand out more clearly. Compare each raw reading against the moving average. Readings that exceed the moving average by more than 25% deserve investigation.
For advanced analysis, use tools like Grafana or Python with pandas. Grafana connects directly to many smart home databases and creates detailed, customizable dashboards. Python scripts can automate anomaly detection using statistical methods or machine learning libraries. Even a simple Z score calculation in Python can flag unusual readings automatically.
If you manage a commercial building, consider connecting your lighting data to your Building Management System. BMS platforms like BACnet or Modbus enabled systems can aggregate data from multiple sources and provide a unified view. This integration makes cross referencing lighting spikes with HVAC, plug loads, and other systems much easier.
Create monthly reports that summarize spike events, their causes, and their resolutions. These reports help you track improvement over time and justify investments in better monitoring tools or hardware upgrades. Share them with your facilities team or household members to build awareness about energy efficiency.
Maintaining Your Detection System for Long Term Accuracy
Detection systems lose accuracy over time if you do not maintain them. Regular upkeep ensures your alerts stay reliable and your data stays clean.
Calibrate your sensors and meters at least once per year. Dust, temperature changes, and aging components can drift sensor readings. A current transformer that read accurately at installation may overreport or underreport after 12 months. Compare your dashboard readings against a known accurate meter to check for drift.
Update your dashboard software and firmware regularly. Software updates often include bug fixes, improved algorithms, and new features for anomaly detection. Firmware updates for smart lighting controllers and sensors fix communication errors that can cause phantom spikes in your data.
Review your alert thresholds quarterly. As your lighting system ages, its baseline consumption may shift. LED fixtures lose a small percentage of output each year, which can subtly change the power draw pattern. Adjust your thresholds to reflect these changes and avoid alert fatigue from outdated settings.
Clean your physical sensors every few months. Dust on occupancy sensors and daylight sensors reduces their accuracy. A dirty daylight sensor may tell the system there is less natural light than there actually is. The system responds by increasing fixture output, which raises consumption and can create false spikes.
Document every change you make to the system. When you replace a fixture, update a schedule, or adjust a threshold, log it with the date and reason. This log becomes invaluable when troubleshooting future spikes. You can look back and see whether a spike started right after a specific change.
Finally, gather feedback from building occupants or household members. They may notice flickering, unexpected brightness changes, or lights turning on at odd times. These observations often point to issues that your dashboard data alone might not reveal.
Frequently Asked Questions
What is a normal power consumption range for smart LED lighting?
Most smart LED bulbs draw between 5 and 15 watts per bulb. Smart LED panels range from 20 to 50 watts depending on size and brightness. Your total zone consumption equals the number of fixtures multiplied by their individual wattage. Any reading that consistently exceeds this calculated value by more than 15% indicates a potential problem worth investigating.
How often should I check my smart lighting dashboard for spikes?
If you have automated threshold alerts set up, you do not need to check manually very often. A weekly review of your dashboard’s historical data is usually enough to catch trends and patterns. For systems without automated alerts, a daily five minute check of the real time graph can help you catch spikes early.
Can power spikes damage my smart lighting fixtures?
Yes, repeated or severe power spikes can shorten the lifespan of LED drivers and other electronic components in your fixtures. Voltage surges can cause immediate failure in sensitive parts. Installing surge protectors on your lighting circuits and setting up automated shutoff alerts can protect your hardware from damage.
Do smart lighting dashboards work with all brands of smart bulbs?
Compatibility depends on the dashboard platform you use. Open platforms like Home Assistant support a wide range of brands and protocols, including Zigbee, Z Wave, and Wi Fi devices. Closed ecosystems may only work with their own branded products. Check your platform’s compatibility list before purchasing new fixtures.
What is the difference between a power spike and high power consumption?
A power spike is a sudden, short lived increase that appears as a sharp peak on your graph. High power consumption is a sustained elevated level that remains above normal for an extended period. Spikes usually indicate hardware faults or scheduling issues. High consumption typically points to configuration errors, such as lights running at full brightness when they should be dimmed.
Can I detect power spikes without a smart lighting dashboard?
You can use standalone energy monitors or smart plugs with power metering to track individual fixture consumption. However, these devices lack the centralized view, historical analysis, and automated alert features that a dashboard provides. For comprehensive spike detection, a dashboard that aggregates data from all your lighting zones is the most effective solution.